Filter statistics

Shows the filter statistics in a given time frame. Enables to compare raw sessions with filtered sessions (grouping and robot filters).

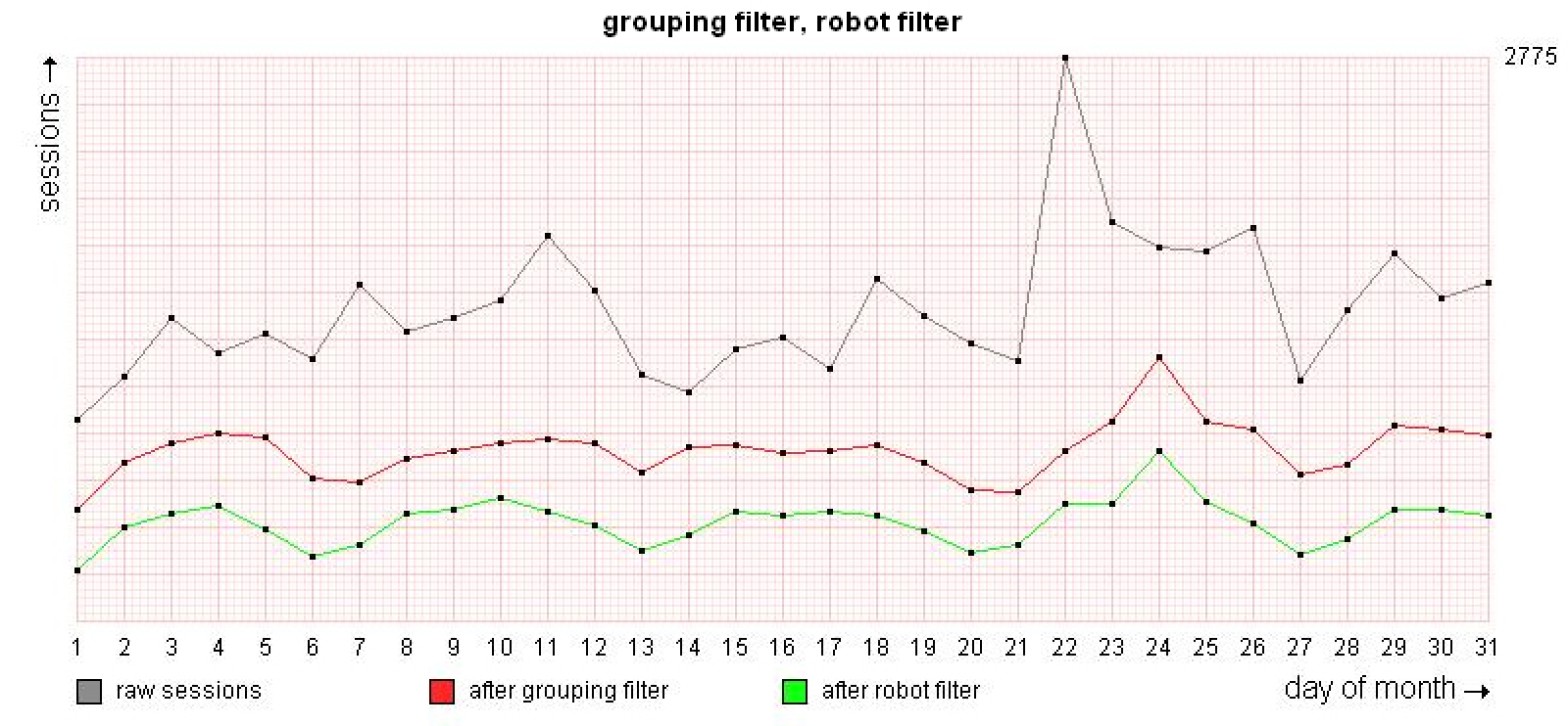
Grouping filter, robot filter graph
Shows the raw sessions against the grouped and robot sessions.| Gray | Raw session. |
| Red | Robot sessions. |
| Green | Real visitors. |
Statistics table
Gives a table with the top, min and average raw session, sessions after grouping filter and sessions after the robot filter.
Robot filter graph
Shows the after grouping filtered sessions against the after robot filtered sessions.| Red | After grouping filter. |
| Green | After robot filter. |
| Blue | Authenticated sessions. |
Statistics table
Gives a table with the top, min and average grouped sessions, after robot filtered sessions and authenticated sessions.
Filtered sessions, robot sessions graph
Shows the grouped sessions against the robot sessions and filtered (visitor) sessions.| Gray | Grouped session. |
| Green | Filtered sessions (visitors). |
| Red | Robot sessions. |
Statistics table
Gives a table with the top, min and average grouped sessions, robot sessions and visitor sessions.
